What’s this?
You're looking at an attempt to visualize co-occurrence and adjacency of games on Valve’s Steam platform.
But what does it mean?
Imagine a game, suppose, Civilization V. There are other games, more or less similar to Civ V: Paradox’ strategy games, Endless Legends or Endless Space, other Civ installments. It’s safe to assume that Civ players should also like these similar games, and therefore, should also have them in their libraries. Following that logic, players of strategy games should tend to have other strategy games in their libraries more often, than, let’s say, driving games. In other words, similar games should be co-occurrent. Presence of one in given user’s library should correlate with the presence of similar games.
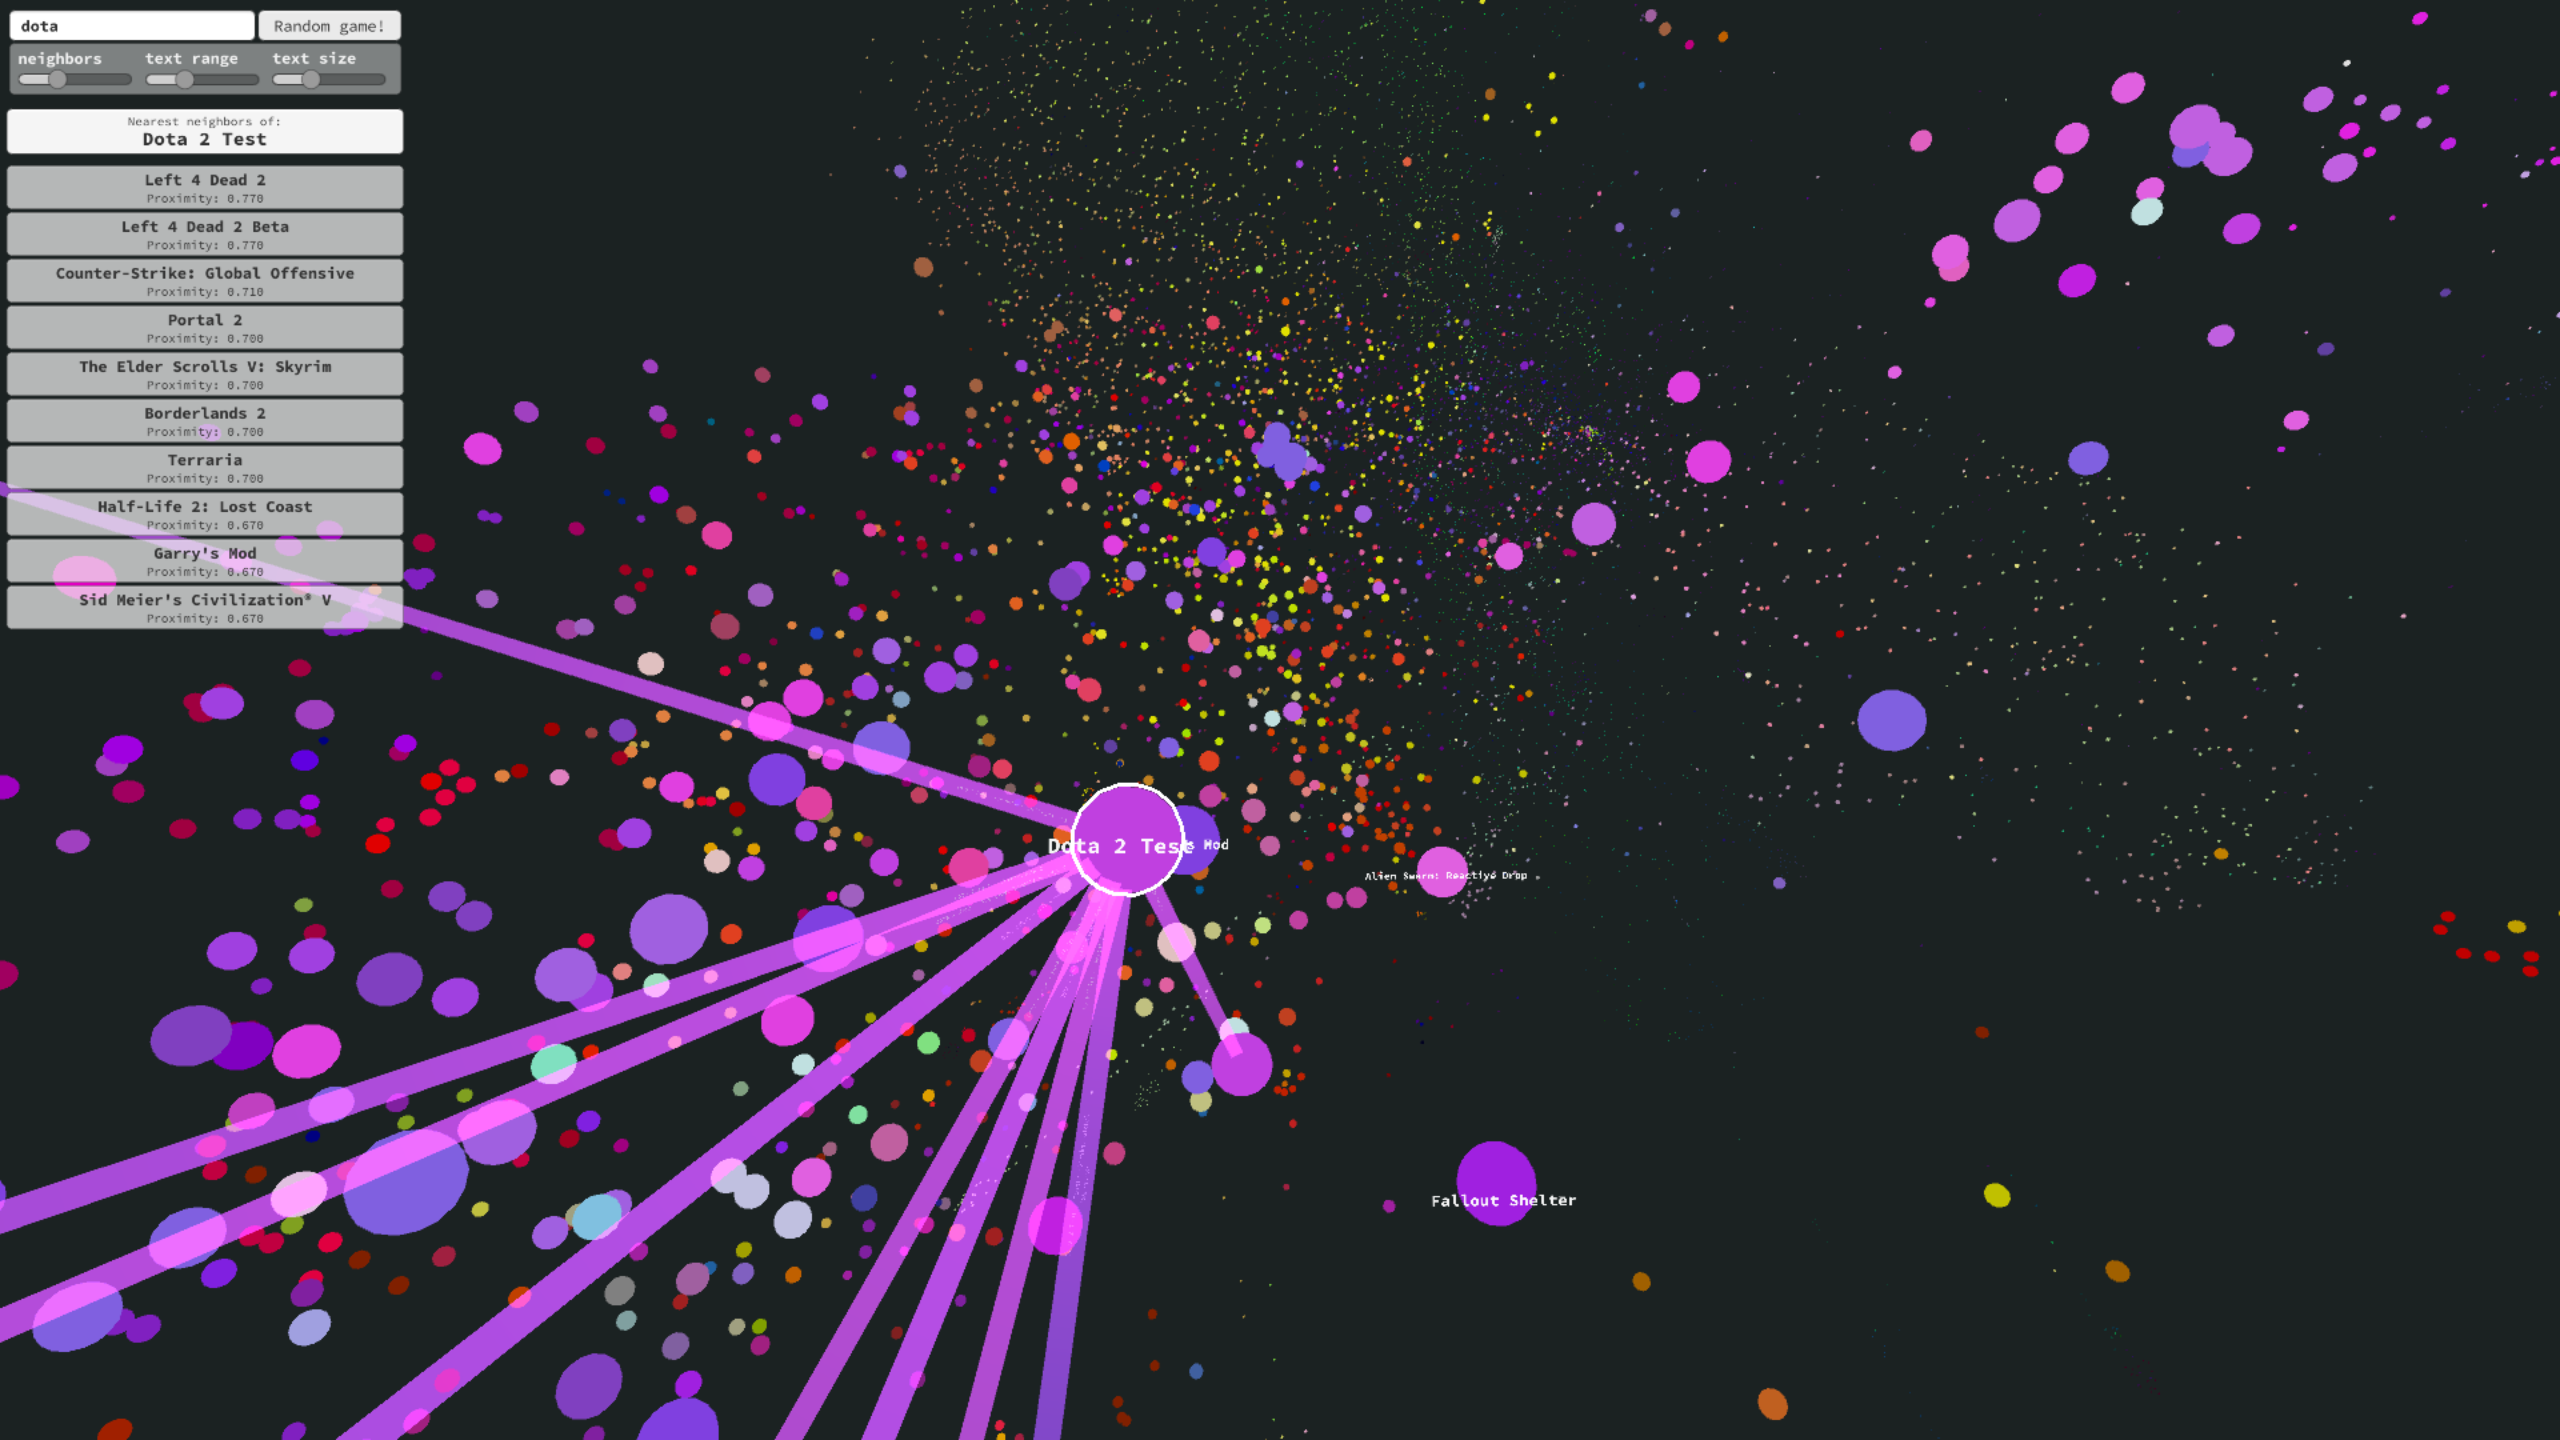
Co-occurrence can be measured. This measurement can then be used to find any game’s neighbors - that is, most correlated games.
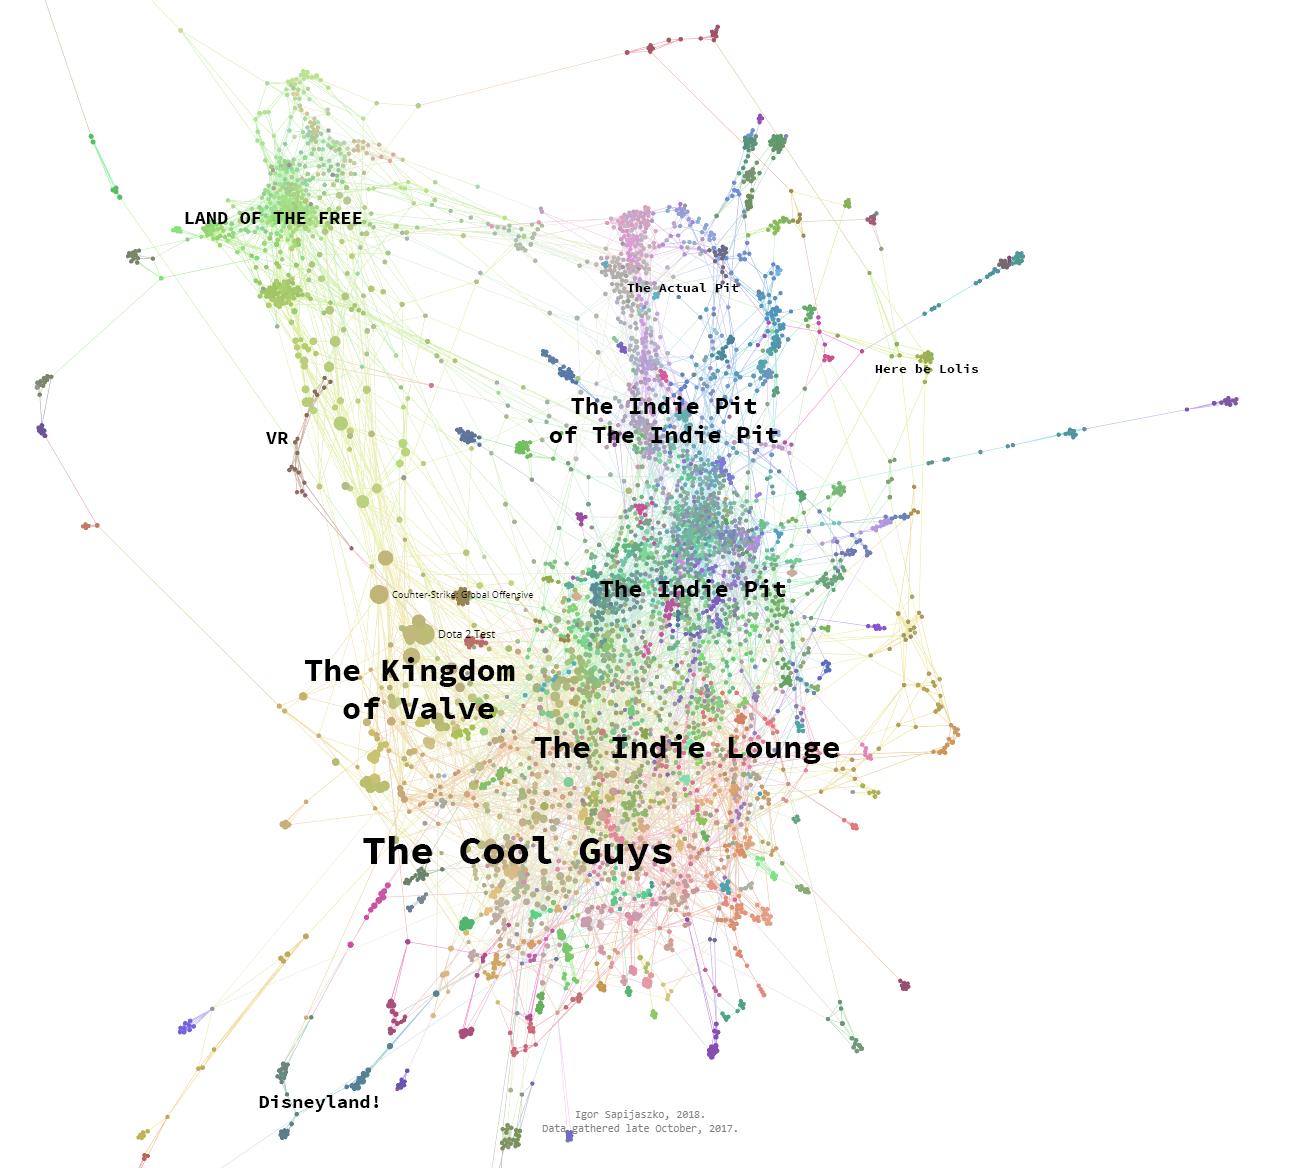
You can see the results in the form of graphs displayed on the site. They show a snapshot of Steam’s games universe, taken late October 2017, based on data gathered from ~500k user profiles. Sadly, like many data visualization projects, it doesn’t show the whole picture. For sake of clarity, I’ve had to trim the number of games to 5.000 most popular games, and number of connections to a maximum of 3 for each game.
Graph, abridged.
Why?
I was curious. :) I don’t think I’ve seen any similar attempts made elsewhere.
What’s next?
This website was meant to be an on-going project, but, sadly, that’s no longer possible. Recently, Valve has changed the default visibility of users’ profiles from public to private, which means that users have to give their explicit permission before their libraries can be accessed. At this moment, there are too few users who allow accessing their libraries, which means gathering new, updated data is difficult. SteamSpy has side-stepped this issue, maybe I'll find a way to do that as well.
Graphs are presented for informative purposes only. I'm not affiliated with Valve.
Methodology
To gather and manipulate data, I’ve used a suite of Python-based tools: Python scripts for API queries and utils, and a lot of Jupyter notebooks for data exploration and ad-hoc transformation.
Graphs are displayed using the sigma.js library. Search is performed using the fuse.js library. I’ve also used Gephi to build visualizations.
Gathering data
User data
It is (or rather: it was) easy to obtain data from Steam’s user libraries. There’s a simple API call which, given correct user ID and API key, will return a neatly formatted JSON with games in user’s library and time spent on each game.
http://api.steampowered.com/IPlayerService/GetOwnedGames/v0001/?key=<insert your key here>&steamid=<insert user id here>&format=json
Example response:
{"response":{"game_count":308,"games":[{"appid":220,"playtime_forever":70},{"appid":320,"playtime_forever":0},{"appid":340,"playtime_forever":0},{"appid":360,"playtime_forever":0},...
JSON responses are simple but heavy to store. I’ve stripped each response off unnecessary data (I needed only game IDs), encoded them, and stored them all in one JSON file that held just a list of 3-value dictionaries: user ID, date of last access, and encoded game string.
My data.json file looked like this:
  ...
{"p": "...", "d": "1710261926", "g": "1js2OBPr4OId5J-7DlRJAvEQVc~r2LCwiNWWENZcwZN~bmivwfQ2sV9TSqejmR8UcN8LM~1D3Pvw.wvEegEI~EB-DxssX"},
{"p": "...", "d": "1710261926", "g": "error"},
{"p": "...", "d": "1710261926", "g": "hsJbyx8owrY7ELPWCOBrQHkgwv4GiKt-Zs4ZQLiYsOWBdlL_nv4h0euf4mdTdrgwFzdYc51UvAdLtL8Hebq.uyjI4~.GzWz9XvArCC9I.~QRXoXc31z0brd-z3Fd.cIYkB"},
  ...
That way, a file containing data of more than 500.000 users weighted slightly more than 250 MB. If I were continue with the project, I’d have to find a better solution, but a single file with all gathered data worked just fine.
Gathering a pool of usable user IDs in the first place was slightly harder. To do so, I’ve gathered data from a Steam Group (this one, to be exact). Each group member has a link to their profile - and it’s just a matter of collecting those profile names into two buckets - one for numerical IDs, and one for custom nicknames.
Games data
To gather most basic data (game name), it’s enough to use just an API request:
https://api.steampowered.com/IStoreService/GetAppList/v1/?key=<your key here>.
At some point, I’ve wanted to get hold of more complex data: developer name, publisher name, tags, etc. I’d used an API request that’s defunct now, and I don’t know if there’s an alternative other than scraping data from Steam store itself.
Making sense of it all
At this point, all we have is a long list of user libraries: arrays like [80, 400, 1020, ...], with each value corresponding to ID of some game.
Each game can be treated as a dimension, with user’s position in that dimension being either 1, if they own the game, or 0 if they don’t. In other words, each user can be thought of as a point in n-dimensional game-space, where n is the total number of different games there exists. Games can be considered the same way: if each user was to be considered a dimension, each game can be thought of as a point in m-dimensional user-space, where m is the total number of users I’ve gathered data of.
Now, with each game considered a point in multi-dimensional space, we can use any applicable metric to measure the distance between each pair of games. Games that are near each other are considered highly correlated, or neighbors.
Before measuring adjacency, I’ve had to select a smaller amount of users to make my user-space for games points. There are three main reasons to do so:
- Memory optimization: given a task of building a 10k x 10k adjacency matrix from 20k-dimensional vectors my PC works just fine but runs out of memory quickly when doing the same based on 500k-dimensional vectors,
- Distance metrics and nearest neighbor computing techniques work best for low-dimensional spaces (not that 20k-dimensional space is THAT low-dimensional)
- Redundancy: I don’t really need entries from players who have only one game in their library, or those who own five hundred different games. There’s not much information to be taken from these.
To trim the number of ‘meaningful’ users, I’ve:
- Discarded games with less than ~100 players (which results in ~10k games),
- Gathered some minimum amount of players (again, about 100) for each game, each player was considered most optimal if they had about 40 games in their libraries,
- For each game, I’ve checked if I have a 100 owners from players I’d already gathered. If not, I’ve found new owners and added them to the pool.
- These threshold or optimal values I’ve used are not based on any thorough testing, they just… kinda worked.
This resulted in about 12k games and 20k users.
Having built a users-games matrix, creating games-games distance matrix can be done by a single function: sklearn.metrics.pairwise(matrix, metric=’cosine’). Calculating an adjacency matrix is just a matter of subtracting distance matrix from np.ones() matrix.
In order to not end up with a graph that has 12k * 12k = 144M edges, all connections with adjacency lower than mean + 3 * standard deviation (calculated per game, not per matrix) were discarded. This, fed directly into Python’s NetworkX library, resulted in a graph with ~12k nodes and ~240k edges.
Visualization medium
I’ve tried various approaches to displaying the data:
3D visualization, based on Unity
Unity is a game engine I’m comfortable with. It means that I could easily add cool features (search, dynamic 2D overlay on top of a 3D scene). Unity, however, has limited web compatibility. The app I’ve built wasn’t even that heavy (8MB), but it didn’t work correctly in Chrome.
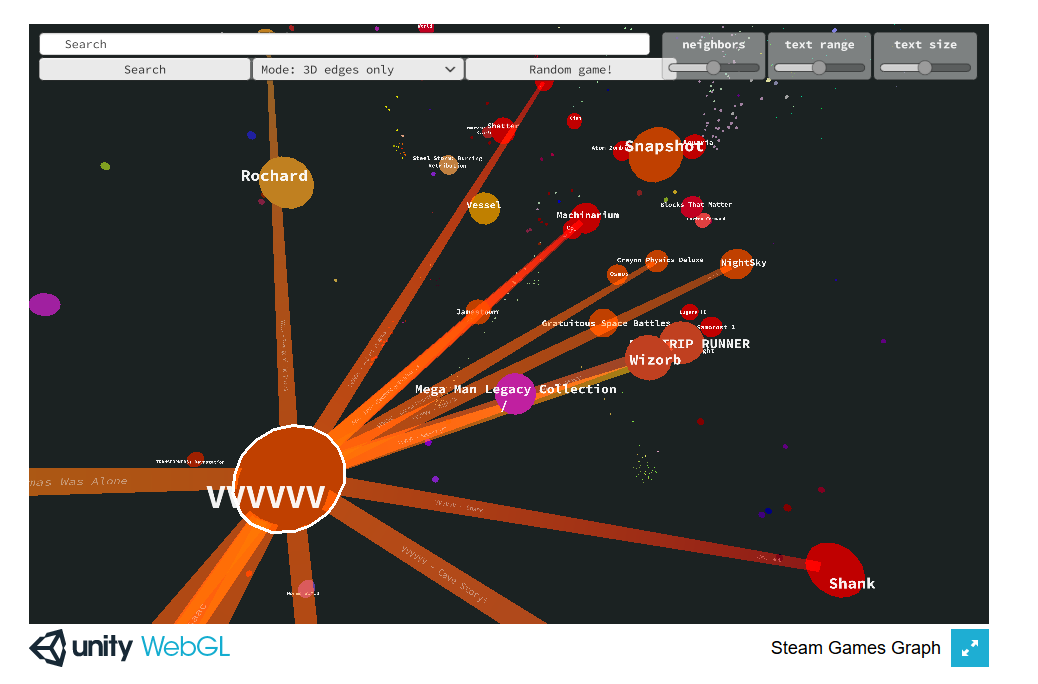
3D graphs in Unity. Left: web player; Right: standalone version.
3D visualization, based on babylon.js
It worked fine… until I’ve wanted to display a multitude of labels, or worse, hide or show labels based on distance from the camera. I don’t think I’ve even got around to displaying edges. I’m sure these obstacles can be overcome, but eventually, I got overwhelmed and took a break from the project.
3D graphs rendered with babylon.js.
2D visualization, based on sigma.js
I’ve settled on a simple, 2D, in-browser visualization. It’s not flashy, but it’s enough.
Visualization method
Final results you see on the website are using two methods of graph visualization.
Steam Games Graph - Gephi’s ForceAtlas2 algorithm
ForceAtlas is an algorithm that simulates attraction and repulsion forces between all nodes: nodes repulse one another, but edges between nodes hold them together. Main strength of this approach (other than visual clarity and attractiveness) is that this algorithm is iterative - even if after some time base data would have changed, the updated graph could use its previous version as its basis. This way, the updated graph would differ only slightly, which would be important in an on-going, continuously updating project.
To make result image more clear, I’ve further reduced the number of nodes and edges, to ~5.000 games and 3 neighbors per game.
Pitfalls of this type of visualization:
- These visualizations are two-dimensional. It means that they’re only a shallow representation of a nuanced structure.
- There can be cases of two games displayed close to each other, despite having little similarity or actual co-occurrence. There's might not be enough space elsewhere for them.
- There can also be cases of games displayed very far from each other, despite being fairly co-occurrent. For example, this can happen where there are two fairly distinct groups of games (let’s say, strategy games and racing games) relatively far from each other, and a game that’s for some reason highly correlated with games from both these groups. In most cases, it will sit awkwardly between these groups, seemingly out of place.
Back when I tried to make the output 3D I’ve even written a small Python library to calculate ForceAtlas for n-dimensions!
Steam Games Tree - Graphviz’ SFDP algorithm
To achieve the tree-like structure of the second graph, I’ve used Graphviz’ plugin to Gephi, with its SFDP algorithm. It’s not iterative, but given that I can’t really update my dataset anymore, it doesn’t really matter. ¯\_(ツ)_/¯
In order to prepare data for this type of presentation, I had to remove all loops from the graph. I've ordered all edges based on their weight, combined with weight (size) of nodes they connect, and cut one after another. If graph was no longer connected after the cut, I've created the connection again.
This graph favors strong connections between large games over weak connections between small games.
Unlike the previous graph, it was constructed from a pool of ~8.000 largest games.
Other approaches
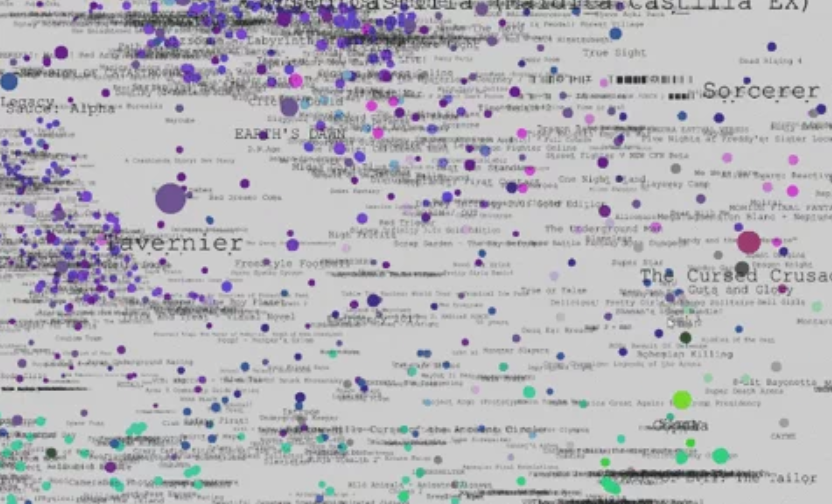
I’ve tried using t-SNE and PCA, but the results were not visually compelling, even if they were more accurate representations of n-dimensional space in 2 or 3 dimensions.

Graph embedded with t-SNE (5k nodes, max 3 connections per node).
Colors
Nodes’ colors are a result of simply embedding nodes into 3D space using t-SNE (based on high-dimensional adjacency matrix calculated earlier), and using 3D positions as RGB values. Which means that nodes colors are meaningful and let us understand actual adjacency more clearly.
Check Kyle McDonald's article on coloring multi-dimensional data visualizations.